What Happened After The SEO Experiment
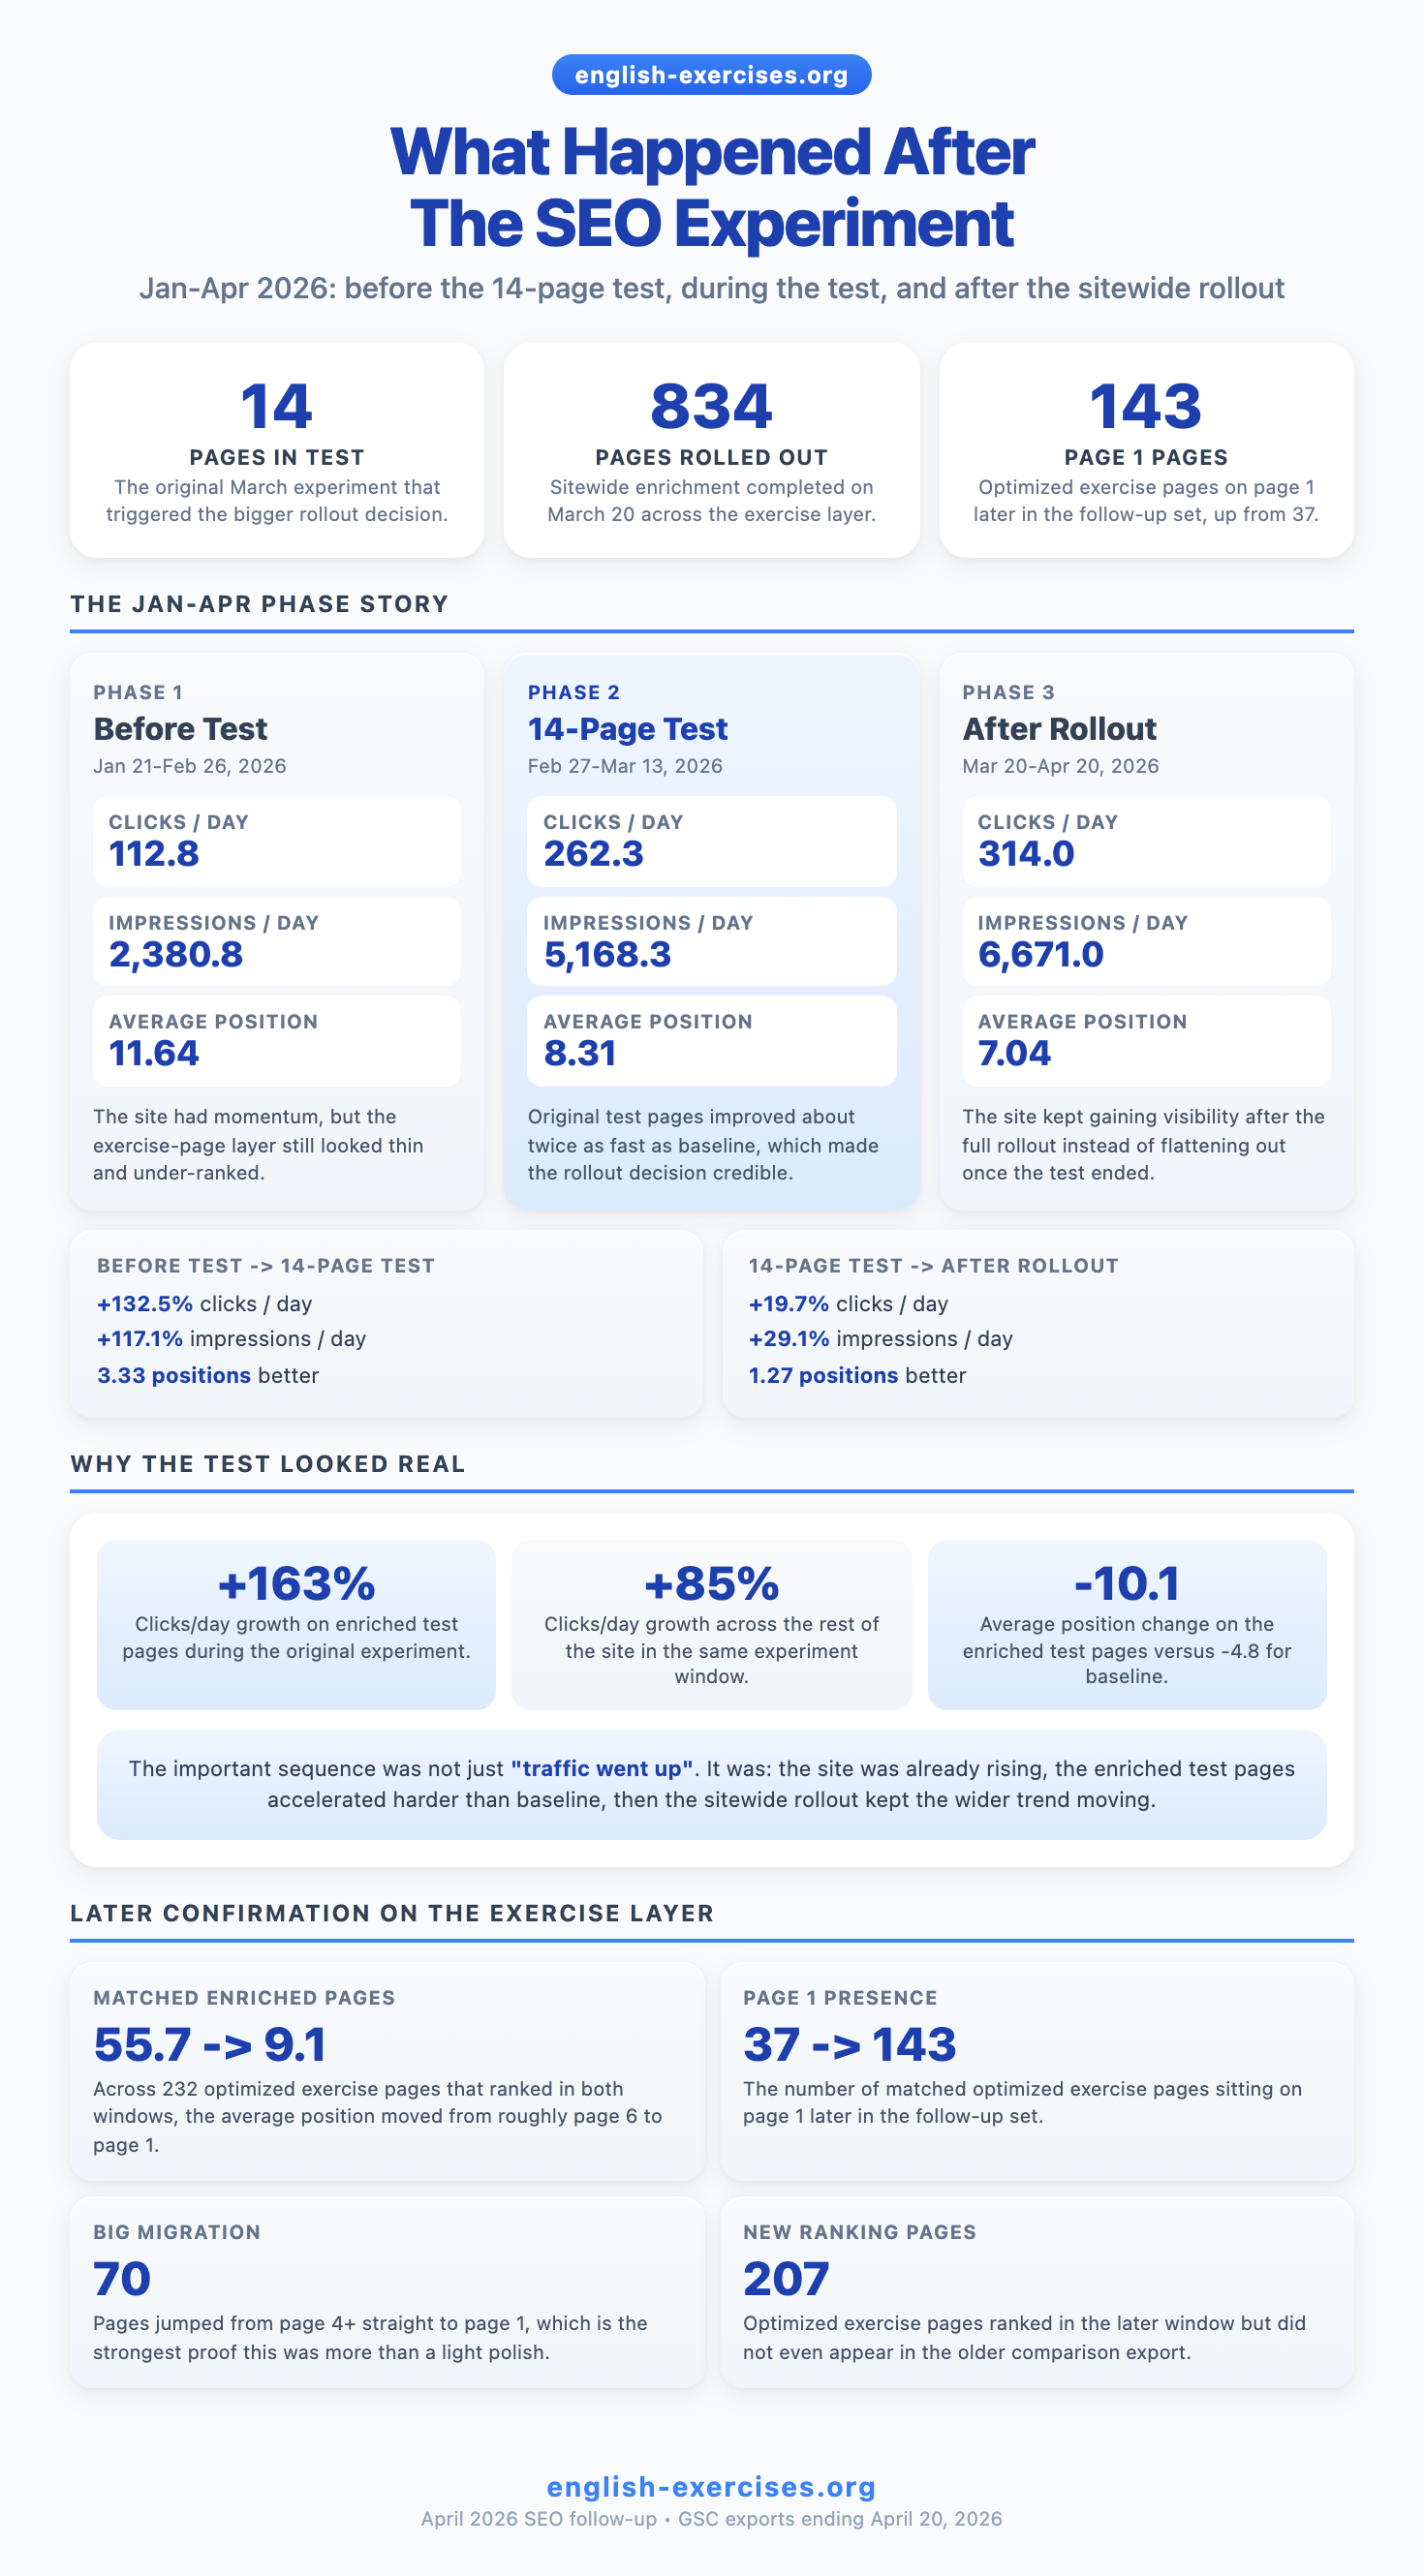
The April follow-up made the useful sequence much clearer: before the 14-page SEO test, during the test, and after the sitewide rollout to 834 exercise pages, the numbers kept moving in the same direction.
A month ago I wrote about a small SEO experiment on 14 grammar exercise pages.
That first test was promising enough to justify a full rollout, but it still left two follow-up questions:
- did the numbers keep moving after the experiment window ended?
- did the sitewide rollout keep the same pattern, or did the original test flatter us?
I pulled the April 22 Search Console exports to check.
The older oct-jan comparison still helps as confirmation, but I do not think it is the main story anymore. The useful read is what happened inside the current jan-apr window:
- before the experiment
- during the 14-page test
- after the sitewide rollout that the test justified
The March Experiment, Quickly
The original post is here:
Back then the pattern was simple.
The hub pages were already doing alright. The individual exercise pages mostly were not.
So I added a reusable ExercisePageSEO wrapper that gave each optimized page:
- a visible H1
- a short server-rendered explanation block
- a quick-rule section with examples
- FAQ content in real HTML
Quiz,BreadcrumbList, andFAQPageJSON-LD- related exercise links where they were missing
The March result was that the 14 enriched test pages improved about twice as fast as the rest of the site.
Useful. But still a small test.
The Sequence Looks Better Than The Single Snapshot
What helped this time was looking at the rollout as three phases instead of one giant before-and-after block.
I also skipped the March 14-19 implementation gap in the phase comparison, because that was the handoff between the experiment and the full rollout.
1. Before the experiment
From January 21 to February 26, 2026, the site was already climbing, but the exercise-page layer still looked underpowered.
Sitewide Google averages in that phase:
- 112.8 clicks/day
- 2,380.8 impressions/day
- position 11.64
That is the period where the problem still felt obvious: the site had momentum, but a lot of exercise pages were still too thin and too invisible.
2. During the 14-page experiment
From February 27 to March 13, the enriched test pages improved faster than the rest of the site:
| Metric | Enriched test pages | Rest of site |
|---|---|---|
| Clicks/day growth | +163% | +85% |
| Impressions/day growth | +140% | +78% |
| Avg position change | -10.1 | -4.8 |
At the sitewide level, the same period also looked much stronger than the pre-test phase:
- 262.3 clicks/day
- 5,168.3 impressions/day
- position 8.31
Versus the pre-experiment phase, that is:
- +132.5% clicks/day
- +117.1% impressions/day
- 3.33 positions better
That was enough for me to stop treating the pattern like a cute little test and start treating it like a product decision.
3. After the sitewide rollout
The full rollout landed on March 20 across 834 exercise pages.
From March 20 to April 20, sitewide Google averages moved again:
- 314.0 clicks/day
- 6,671.0 impressions/day
- position 7.04
Versus the experiment window, that is:
- +19.7% clicks/day
- +29.1% impressions/day
- 1.27 positions better
CTR softened a bit in that phase, which I am not especially worried about yet. The site was showing up for more queries, across more pages, with broader reach. That usually means impressions grow faster than clicks for a while.
So the shape of the story is:
- the site was already rising before the test
- the 14-page test improved faster than baseline
- the full rollout happened
- the wider visibility gains kept going afterward
That is much more interesting than a single oct-jan versus jan-apr comparison.
It Was Not Just The Whole Site Floating Up
The whole domain did keep rising. That much is true.
So I compared the optimized exercise pages against a control-ish slice of matched non-hub, non-enriched pages.
| Metric | Enriched exercise pages | Other matched pages |
|---|---|---|
| Click growth | +1,744% | +1,330% |
| Impression growth | +1,014% | +838% |
| CTR change | +1.74pp | +1.33pp |
| Avg position change | -46.6 | -19.4 |
The ranking gap is the thing to focus on.
The optimized exercise pages improved by 46.6 positions on average. The other matched pages improved by 19.4.
So yes, the site was already climbing. But the optimized exercise layer climbed much harder.
The Older Comparison Is Just The Confirmation Layer
I still did the broader comparison as a confirmation layer, just not as the main story.
Among the 232 optimized exercise pages that ranked in both windows:
| Metric | Oct 23-Jan 20 | Jan 21-Apr 20 | Change |
|---|---|---|---|
| Clicks | 266 | 4,904 | +1,744% |
| Impressions | 10,048 | 111,893 | +1,014% |
| CTR | 2.65% | 4.38% | +1.74pp |
| Avg position | 55.66 | 9.08 | 46.6 positions better |
That is the big supporting signal.
These pages were not hovering around page 2 and getting a nice little polish. As a class they went from roughly page 6 to roughly page 1.
The bucket migration is the most useful way to read it:
- page-one optimized exercise pages: 37 -> 143
- page-four-or-worse optimized exercise pages: 143 -> 16
- 70 pages moved from page 4+ straight to page 1
- 45 pages moved from page 4+ to page 2
So the broader 90-day comparison is still valuable. I just think it works better as confirmation than as the headline.
The Original 14 Experiment Pages Mostly Held Up
I also checked the same pages from the March write-up.
In aggregate those 14 pages went from:
- 53 clicks in the earlier window to 776 clicks in the current one
- position 66.7 to position 12.7
That is not the same date methodology as the March test, so I would not pretend it is a clean continuation of the original A/B.
But it does answer the practical question I actually cared about:
did the first experiment just spike and fade?
Mostly no.
Some good follow-ups:
conditionals-with-modals-exerciseswas the ugly March regression. It later recovered to position 8.86.unless-clauses-exercisesstayed strong and now sits at 6.55.passive-voice-negativesis now at 3.79.modal-must-have-toclimbed into real traffic.zero-conditional-exerciseswent from basically buried to around 12.68.
Some pages are still clearly not finished:
articles-a-vs-animproved, but still sits around 23.7passive-voice-present-simpleimproved a lot, but still leaks slash-duplicate signalspresent-simple-vs-continuousstill is not a traffic winner
Which is fine. A repeatable pattern does not mean every page becomes magic.
The Scale Story Matters Too
The matched set is only part of the picture.
There are also 207 optimized exercise pages that ranked in the current window but did not appear in the earlier comparison export at all.
That means the enrichment work did two useful things at once:
- it made old weak pages much more rankable
- it expanded the number of exercise pages Google was willing to rank in the first place
That second point is easy to miss if you only stare at the original 14-page test.
Which Optimized Exercise Pages Are Winning Now
A few of the current leaders:
reported-speech-mixed-advanced— 331 clicks, position 6.56reported-speech-modal-verbs— 256 clicks, position 5.30unless-clauses-exercises— 227 clicks, position 6.55conditionals-mixed-advanced-exercises— 206 clicks, position 5.98passive-voice-negatives— 121 clicks, position 3.79
That pattern is interesting.
The strongest exercise-page winners are often:
- advanced or mixed practice pages
- comparison pages
- transformation-style pages
- grammar problems with clear search intent
Which makes sense. Those are the pages where searchers usually know exactly what they want.
What I Think Actually Worked
I do not think there was one magical ingredient here.
The likely gain came from stacking a few boringly useful things on the same page:
- visible server-rendered headings
- enough explanatory copy to make the page self-describing
- structured data that matched the page type
- examples that made the topic more concrete
- internal links that helped the page sit inside a topic cluster
In other words, the optimized exercise pages stopped looking like thin React shells and started looking like actual educational pages.
Fair enough, really.
What Still Needs Work
The next step is not more victory laps.
The next step is cleanup and tighter targeting:
- finish the trailing-slash and non-www canonical cleanup on the pages still leaking signals
- revisit the stubborn underperformers like
articles-a-vs-an - keep pushing the winners with stronger internal linking from the hubs
- do more CTR work on the page-one and page-two head terms that already have search volume
The interesting thing now is not “can exercise pages rank?” That question is answered.
The interesting thing now is how far this layer can go once the obvious technical leakage is removed and the weak-intent pages are tightened up.
The Real Takeaway
The March experiment looked real.
The April follow-up makes me a lot more confident saying that out loud.
The exercise-page SEO work was not cosmetic. It materially changed how those pages rank.
As a layer, they went from almost invisible to useful.
That is enough to keep going.
Related: